Unveiling the Mystery: Can the MACD Histogram Predict Trend Changes Like Magic?
In the world of financial markets, traders and investors are constantly seeking out new tools and indicators to help them make informed decisions about the direction of asset prices. One such popular tool is the MACD histogram, short for Moving Average Convergence Divergence histogram. This indicator, derived from the MACD line, is utilized by many as a means of anticipating potential changes in trends and market conditions.
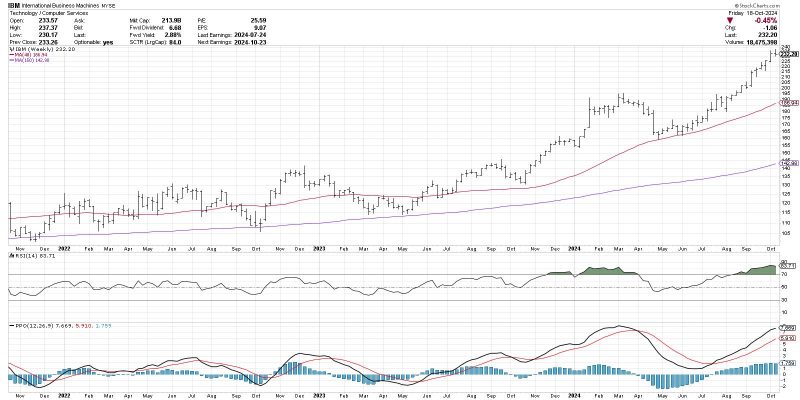
The MACD histogram is a technical indicator that represents the difference between the MACD line and the signal line. It consists of vertical bars that oscillate above and below the zero line, providing traders with visual cues regarding the strength and direction of a trend. Analysts often look to the MACD histogram for signals of both bullish and bearish momentum shifts in the market.
One of the key ways in which traders can utilize the MACD histogram is by identifying divergence between the indicator and price action. Divergence occurs when the MACD histogram is moving in the opposite direction of the price, signaling a potential shift in momentum. Bullish divergence, for example, occurs when the price makes lower lows while the MACD histogram forms higher lows, suggesting a possible reversal to the upside.
Additionally, the MACD histogram can help traders identify overbought or oversold conditions in the market. When the histogram bars extend far above the zero line, it may indicate that an asset is overbought and due for a correction. Conversely, when the bars dip significantly below the zero line, it could signal that the asset is oversold and ripe for a potential bounce.
Furthermore, the MACD histogram can be used in conjunction with other technical indicators to confirm trading signals. By waiting for confluence between the MACD histogram, other momentum indicators, and price action, traders can increase the likelihood of successful trades while reducing the risk of false signals.
While the MACD histogram can be a valuable tool in predicting trend changes and market reversals, it is essential for traders to exercise caution and not rely solely on this indicator. Like all technical analysis tools, the MACD histogram is not foolproof and should be used in conjunction with other forms of analysis and risk management techniques.
In conclusion, the MACD histogram is a popular and effective tool for anticipating trend changes and market conditions in the world of trading and investing. By understanding how to interpret divergence, overbought/oversold conditions, and confirming signals with other indicators, traders can harness the power of the MACD histogram to make informed decisions and improve their trading outcomes.
