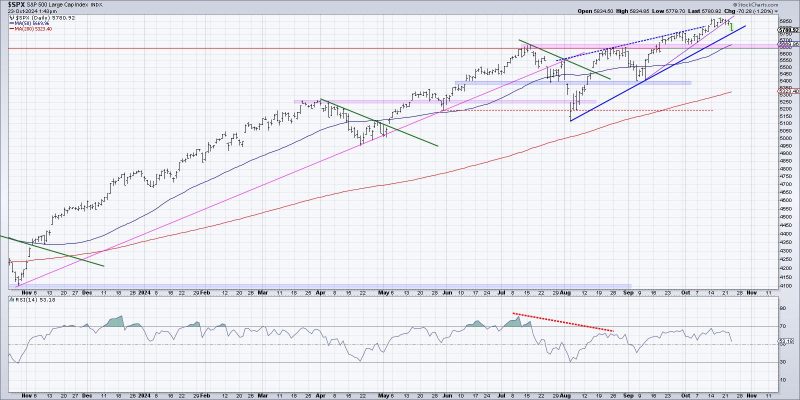
Unlock the Power of Visualization for Identifying a Potential Distribution Phase in Three Easy Steps!
Visualizing potential distribution phases can be a key factor in making informed investment decisions. As an investor, understanding the market dynamics and spotting early signs of a distribution phase can help in minimizing risks and maximizing returns. Here are three effective ways to visualize the start of a potential distribution phase:
1. Volume Analysis:
Volume analysis plays a crucial role in identifying distribution phases in the market. In the early stages of distribution, there is often an increase in trading volume as smart money starts to distribute their holdings to retail investors. By analyzing volume patterns relative to price movements, investors can spot divergence between price and volume, indicating a potential distribution phase. If there is a surge in volume accompanied by a lack of significant price movement or a series of lower highs and lower lows, it could signal the beginning of distribution.
2. Price Action and Support/Resistance Levels:
Observing price action along with key support and resistance levels can provide valuable insights into the start of a distribution phase. During distribution, the price typically struggles to break above a certain resistance level, forming a distribution range or top pattern. Investors can visualize the formation of lower highs and lower lows within this range, indicating a shift in supply and demand dynamics. The failure of the price to sustain above key resistance levels, despite multiple attempts, is a common sign of distribution in the market.
3. Relative Strength and Market Breadth:
Monitoring the relative strength of individual stocks or sectors compared to the broader market indices can help investors gauge the strength of the ongoing distribution phase. In the early stages of distribution, certain sectors or stocks may show signs of weakness compared to the overall market, indicating a rotation of capital away from these assets. Similarly, analyzing market breadth indicators such as the advance-decline line or the percentage of stocks trading above key moving averages can reveal underlying weakness in the market. A divergence between the market indices and the breadth indicators can hint at a potential distribution phase.
In conclusion, visualizing the start of a potential distribution phase requires a combination of technical analysis tools and a deep understanding of market dynamics. By incorporating volume analysis, price action, support/resistance levels, relative strength, and market breadth into the analysis, investors can enhance their ability to identify distribution phases early on. Staying vigilant and adapting to changing market conditions are essential aspects of successful investing in the ever-evolving financial markets.
