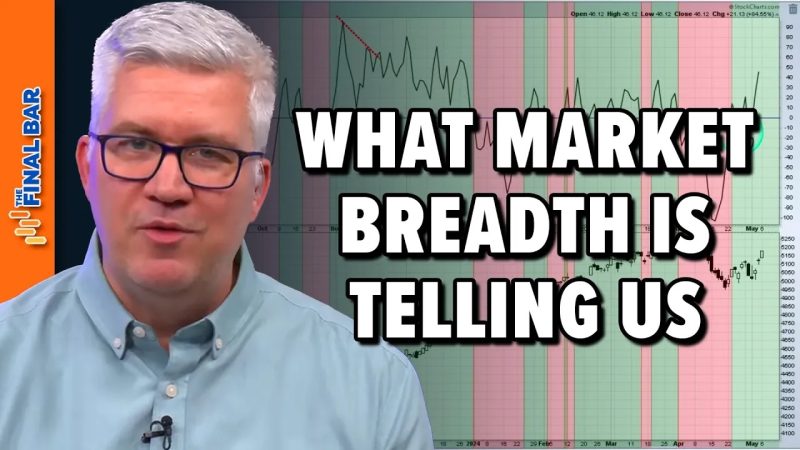
When it comes to understanding the dynamics of the stock market, investors often rely on a variety of indicators to gauge the health and direction of the markets. One such essential indicator that investors should pay close attention to is the market breadth indicator. Market breadth refers to the number of companies advancing compared to those declining within a particular index or exchange.
While traditional market indicators like the S&P 500 or Dow Jones Industrial Average provide a snapshot of market performance based on a limited number of large-cap stocks, market breadth indicators offer a more comprehensive view by considering the breadth of the market – that is, the performance of a broader range of stocks.
One commonly used market breadth indicator is the Advance-Decline Line (AD Line). The AD Line tracks the cumulative number of advancing stocks minus declining stocks over a specific period. A rising AD Line indicates that more stocks are advancing than declining, signaling broad market strength. Conversely, a falling AD Line suggests weakening market breadth, as more stocks are declining than advancing.
Another powerful market breadth indicator is the Arms Index, also known as the TRIN (short for Trading Index). The Arms Index calculates the ratio of advancing stocks to declining stocks relative to advancing volume to declining volume. A reading above 1.0 indicates bearish sentiment, while a reading below 1.0 suggests bullish sentiment. The Arms Index helps investors determine whether trading activity is being driven by a few large-cap stocks or if there is broader participation throughout the market.
In addition to the AD Line and the Arms Index, investors can also look at market breadth indicators like the McClellan Oscillator, which measures the difference between advancing and declining issues on the NYSE, smoothed over a 19-day exponential moving average. The McClellan Oscillator helps identify overbought or oversold conditions in the market and can be a useful tool for anticipating market reversals.
Monitoring market breadth indicators is crucial for investors looking to gauge the overall health of the stock market. While major indices like the S&P 500 can provide a general sense of market direction, market breadth indicators offer a deeper insight into market internals and the participation of individual stocks.
By tracking market breadth indicators like the AD Line, Arms Index, and McClellan Oscillator, investors can gain a more nuanced understanding of market sentiment and potential shifts in market direction. These indicators can serve as valuable tools for making informed investment decisions and managing risk in an ever-changing market environment.

